
Dental Implant Statistics: Market Growth, Success Rates, Costs, and Long-Term Outcomes
Dental implants are titanium posts placed into the jawbone to replace missing tooth roots and support crowns or dentures. In the United States, demand continues to grow due to aging adults, tooth loss, and digital planning tools.
Current data shows strong clinical outcomes for dental implants and steady market expansion. We review verified dental implant statistics below and explain what they mean. Keep reading for detailed data on costs, risks, and long-term outcomes.
Key Statistics for Dental Implants
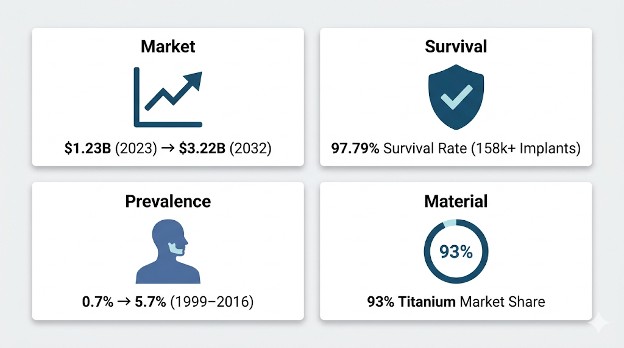
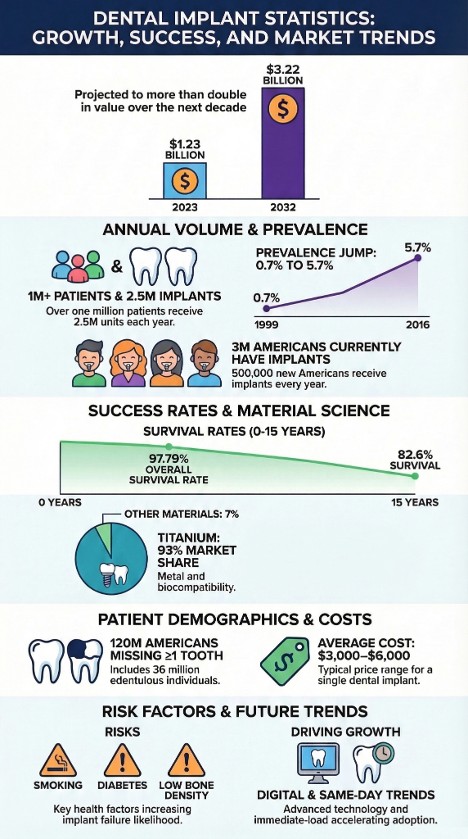
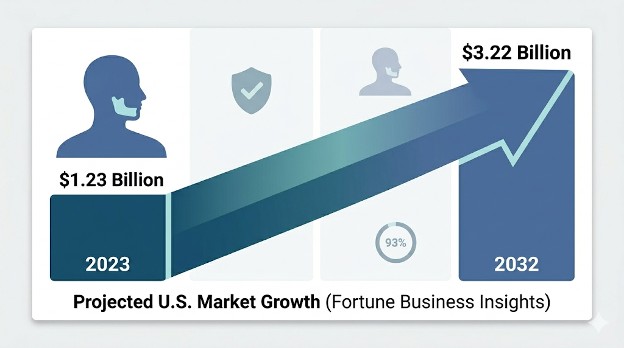
- How large is the U.S. market? The U.S. dental implant market was valued at 23 billion USD in 2023, with projections reaching 3.22 billion USD by 2032.
- How many procedures occur each year? Over 1 million patients receive implant treatment annually, with approximately 2.5 million individual implants placed per year.
- How common are implants among adults? Prevalence increased from 7% in 1999-2000 to 5.7% in 2015-2016.
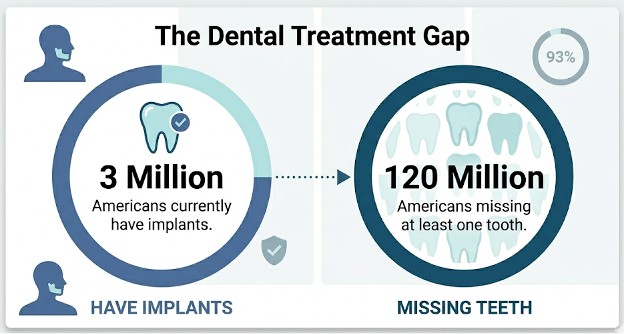
- How many Americans currently have implants? Around 3 million Americans have dental implants, with roughly 500,000 new patients added each year.
- What is the overall implant survival rate? Large-scale clinical data show a 79% survival rate across over 158,000 implants.
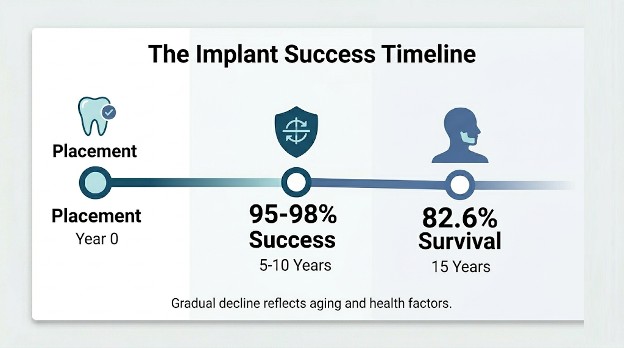
- What is the long-term success rate? Research indicates a 95% to 98% success rate within 5-10 years, declining to approximately 6% survival at 15 years.
- How much does a single implant cost? The average price ranges from 3,000 to 6,000 USD per tooth, though costs can exceed this range depending on case complexity and geographic location.
- How dominant is titanium? Titanium dental implants account for approximately 93% of the U.S. implant market, making it the dominant material segment.
- How widespread is tooth loss? The American College of Prosthodontists estimates that 120 million Americans are missing at least one tooth and over 36 million have lost all teeth.
How Common Is the Dental Implant Procedure in the United States?
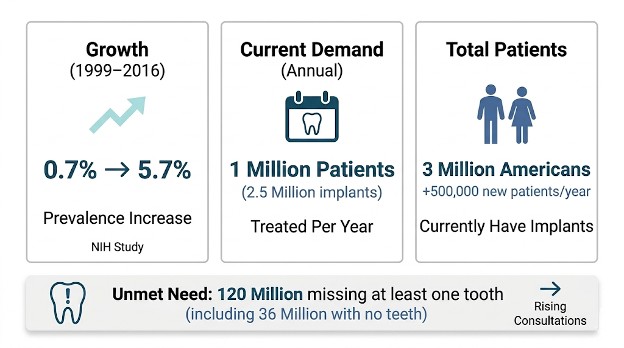
Dental implant demand continues to rise across the country. According to the American Academy of Implant Dentistry, over 1 million patients receive implant treatment each year, with approximately 2.5 million individual implants placed annually. Industry reports indicate that nearly 3 million Americans already have dental implants, with about 500,000 new patients joining that number each year.
Data from a national prevalence study shows that implant prevalence increased from 0.7% to 5.7% between 1999-2000 and 2015-2016. This growth reflects better awareness, improved surgical techniques, and stronger clinical outcomes.
Unmet need remains significant. The American College of Prosthodontists reports that 120 million Americans are missing at least one tooth and more than 36 million have no teeth at all. These numbers explain why implant consultation searches continue increasing.
What Is the Implant Success Rate and Survival Rate?
Clinical research shows strong implant success and survival outcomes. A large-scale study published in BMC Oral Health analyzing over 158,000 implants reported an overall survival rate of 97.79%, with a total failure rate of just 2.21%.
Separately, a retrospective study in Clinical and Experimental Dental Research found a 98.4% survival rate for implants placed immediately after extraction and 98.6% for those in fully healed sites. Within 5-10 years, success rates generally range from 95% to 98%.
Over longer periods, outcomes remain favorable but show a gradual decline. A large retrospective study reported an 82.6% 15-year survival rate, reflecting the cumulative effects of aging, maintenance patterns, and patient health factors over time.
These outcomes confirm that early implant failure remains uncommon when proper placement protocols and maintenance steps are followed.
What Factors Cause Implant Failure?
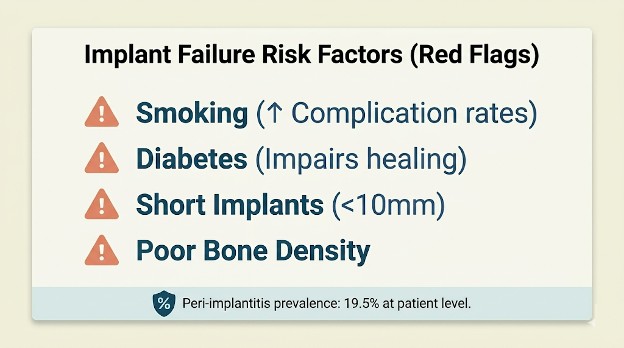
Implant failure can be caused by biological and mechanical risks. A systematic review and meta-analysis published in PMC reports that the prevalence of peri-implantitis is approximately 19.53% at the patient level and 12.53% at the implant level. This condition affects biofilm control and the integrity of the marginal bone around implants.
Common risks and contributing factors include:
- Smoking, which increases complication rates significantly
- Diabetes, which impairs healing and osseointegration
- Short implants under 10mm in length
- Narrow diameter implants under 3.75mm
- Poor jawbone density at the implant site
Smoking data consistently shows higher complication rates, especially in maxillary implants. Diabetes increases early failure odds. These risk factors are assessed during consultation and radiographic evaluation to reduce the risk of late failure.
How Big Is the Dental Implant Market?
United States Market
The U.S. dental implant market was valued at approximately 1.23 billion USD in 2023, according to Fortune Business Insights, with projections reaching 3.22 billion USD by 2032. Growth is driven by an aging population, rising awareness of edentulism, and expanding insurance coverage for implant procedures.
Note: Separate industry estimates from Nova One Advisor value the broader U.S. dental implant market at approximately 5.94 billion USD in 2025, projected to reach 12.83 billion USD by 2034 at an 8.94% CAGR. Differences in scope and methodology (e.g., including abutments, prosthetics, and related services) account for the variation between sources.
Global Market
The global dental implant market was valued at approximately 4.6 billion USD in 2024, with forecasts projecting growth to roughly 10.38 billion USD by 2034 at a CAGR of approximately 8.5%. North America accounts for the largest regional share, followed by Europe and Asia-Pacific.
Key Growth Drivers
Market expansion is fueled by several converging trends:
- Aging populations with increased tooth loss
- Advances in guided surgery and digital implant planning
- Growing patient awareness and demand for fixed restorations
- Expansion of dental insurance coverage for implant procedures
- Adoption of immediate-load and same-day implant protocols
How Much Do Dental Implants Cost?
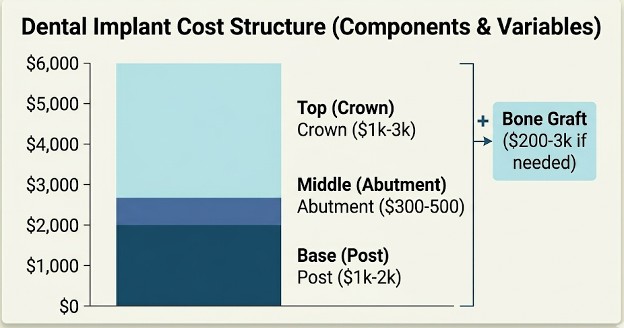
The average cost for a single dental implant in the United States ranges from 3,000 to 6,000 USD. This estimate typically includes the implant post, abutment, and crown, but costs can vary significantly depending on geographic location, case complexity, bone grafting needs, and provider fees. Full-mouth restorations can reach 20,000 to 50,000 USD or more.
Cost Breakdown by Component
| Component | Estimated Cost Range |
| Implant post (titanium or zirconia) | 1,000-2,000 USD |
| Abutment | 300-500 USD |
| Crown (porcelain or ceramic) | 1,000-3,000 USD |
| Bone graft (if required) | 200-3,000 USD |
| Sinus lift (if required) | 1,500-3,000 USD |
Insurance coverage for implants remains limited but is expanding. Many patients use dental discount plans, CareCredit, or health savings accounts (HSAs) to manage out-of-pocket costs.
What Material Is Most Commonly Used?
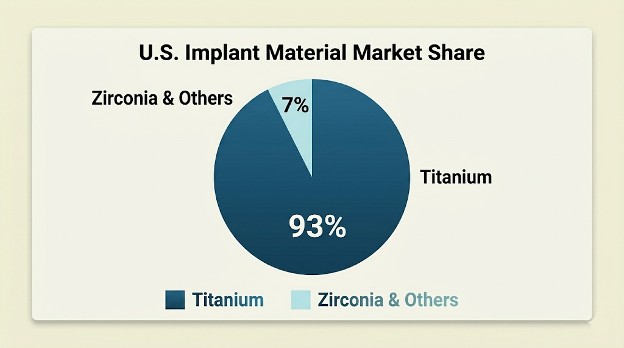
Titanium dental implants account for approximately 93% of the U.S. implant market. Titanium’s dominance is rooted in decades of clinical evidence supporting its biocompatibility, osseointegration performance, and long-term durability.
Zirconia implants represent a growing alternative, particularly for patients seeking metal-free options. However, long-term clinical evidence for zirconia remains limited compared with titanium, and its market share remains in the single digits.
Who Gets Dental Implants? Demographic Trends
According to national prevalence data, dental implant use varies by age, income, and education:
- Adults aged 65-74 show the highest prevalence of implant use
- Higher-income individuals are significantly more likely to have implants
- College-educated adults have higher implant rates than those without college degrees
- Men and women receive implants at roughly equal rates
The American College of Prosthodontists notes that 120 million Americans are missing at least one tooth and over 36 million are fully edentulous, highlighting the remaining gap between need and treatment.
What Are the Current Trends and Future Outlook?
Several developments are shaping the dental implant landscape in 2025 and beyond:
- Digital workflow integration: Cone-beam CT scanning, intraoral scanners, and AI-assisted planning are becoming standard in implant practices.
- Immediate-load protocols: Same-day implant placement and provisionalization significantly reduce treatment timelines.
- Guided surgery: Computer-guided implant placement improves accuracy and reduces complications.
- Material innovation: Zirconia implants and surface-modified titanium implants continue to gain research attention.
- Expanding access: Increasing insurance coverage and financing options are broadening the patient base.
Market projections from both Fortune Business Insights and Nova One Advisor indicate sustained growth through the early 2030s, driven by demographic demand and technological advancement.
Summary
Dental implants remain one of the most successful procedures in restorative dentistry. With survival rates above 97% in large-scale studies, a growing U.S. market valued at billions, and steadily increasing patient adoption, the outlook for dental implants is strong. Titanium continues to dominate the material market at roughly 93%, while costs average 3,000-6,000 USD per implant with significant variability. The gap between the 120 million Americans who are missing teeth and the 3 million who have implants represents a massive growth opportunity for the industry.
References
- Fortune Business Insights – U.S. Dental Implants Market: fortunebusinessinsights.com/u-s-dental-implants-market-107828
- AAID – Trends in Dental Implants (Prevalence & Annual Data): connect.aaid-implant.org/blog/trends-in-dental-implants-2022
- PMC – National Prevalence of Dental Implants (Elani et al.): pmc.ncbi.nlm.nih.gov/articles/PMC6854267
- American College of Prosthodontists – Facts & Figures: gotoapro.org/facts-figures
- PMC / BMC Oral Health – Implant Survival Analysis (158,000+ implants): pmc.ncbi.nlm.nih.gov/articles/PMC11856851
- Wiley – Immediate vs. Delayed Implant Survival: onlinelibrary.wiley.com/doi/10.1002/cre2.70096
- PubMed – Long-Term Implant Survival (15-Year Data): pubmed.ncbi.nlm.nih.gov/31359446
- PMC – Peri-Implantitis Prevalence Meta-Analysis: pmc.ncbi.nlm.nih.gov/articles/PMC9583568
- CareCredit – Single Tooth Implant Cost Guide: carecredit.com/well-u/health-wellness/single-tooth-implant
- ADA Health Policy Institute – Dental Coverage Data: ada.org/resources/research/health-policy-institute
- Nova One Advisor – Dental Implants Market Report (Material Segmentation): novaoneadvisor.com/report/dental-implants-market
